Top 5 Observability Tools for 2026: Features, Use Cases & Stack Comparison
Introduction
Observability in 2026 is no longer about just collecting metrics or searching logs. It’s about correlating metrics, logs, and traces fast enough to make decisions before users feel pain. Teams that still treat observability as a passive monitoring setup are already behind.
Modern systems are:
- distributed,
- cloud-native,
- Kubernetes-heavy,
- and constantly changing.
That reality is why observability tools have shifted from “nice-to-have dashboards” to core reliability infrastructure.
This guide cuts through the noise and focuses on five observability tools that actually matter in 2026, based on:
- real-world adoption,
- architectural relevance,
- scalability under load,
- and how teams actually use them in production.
We’re not ranking tools by hype. We’re comparing them by what problem they solve best.
The 5 Observability Tools Compared in This Guide
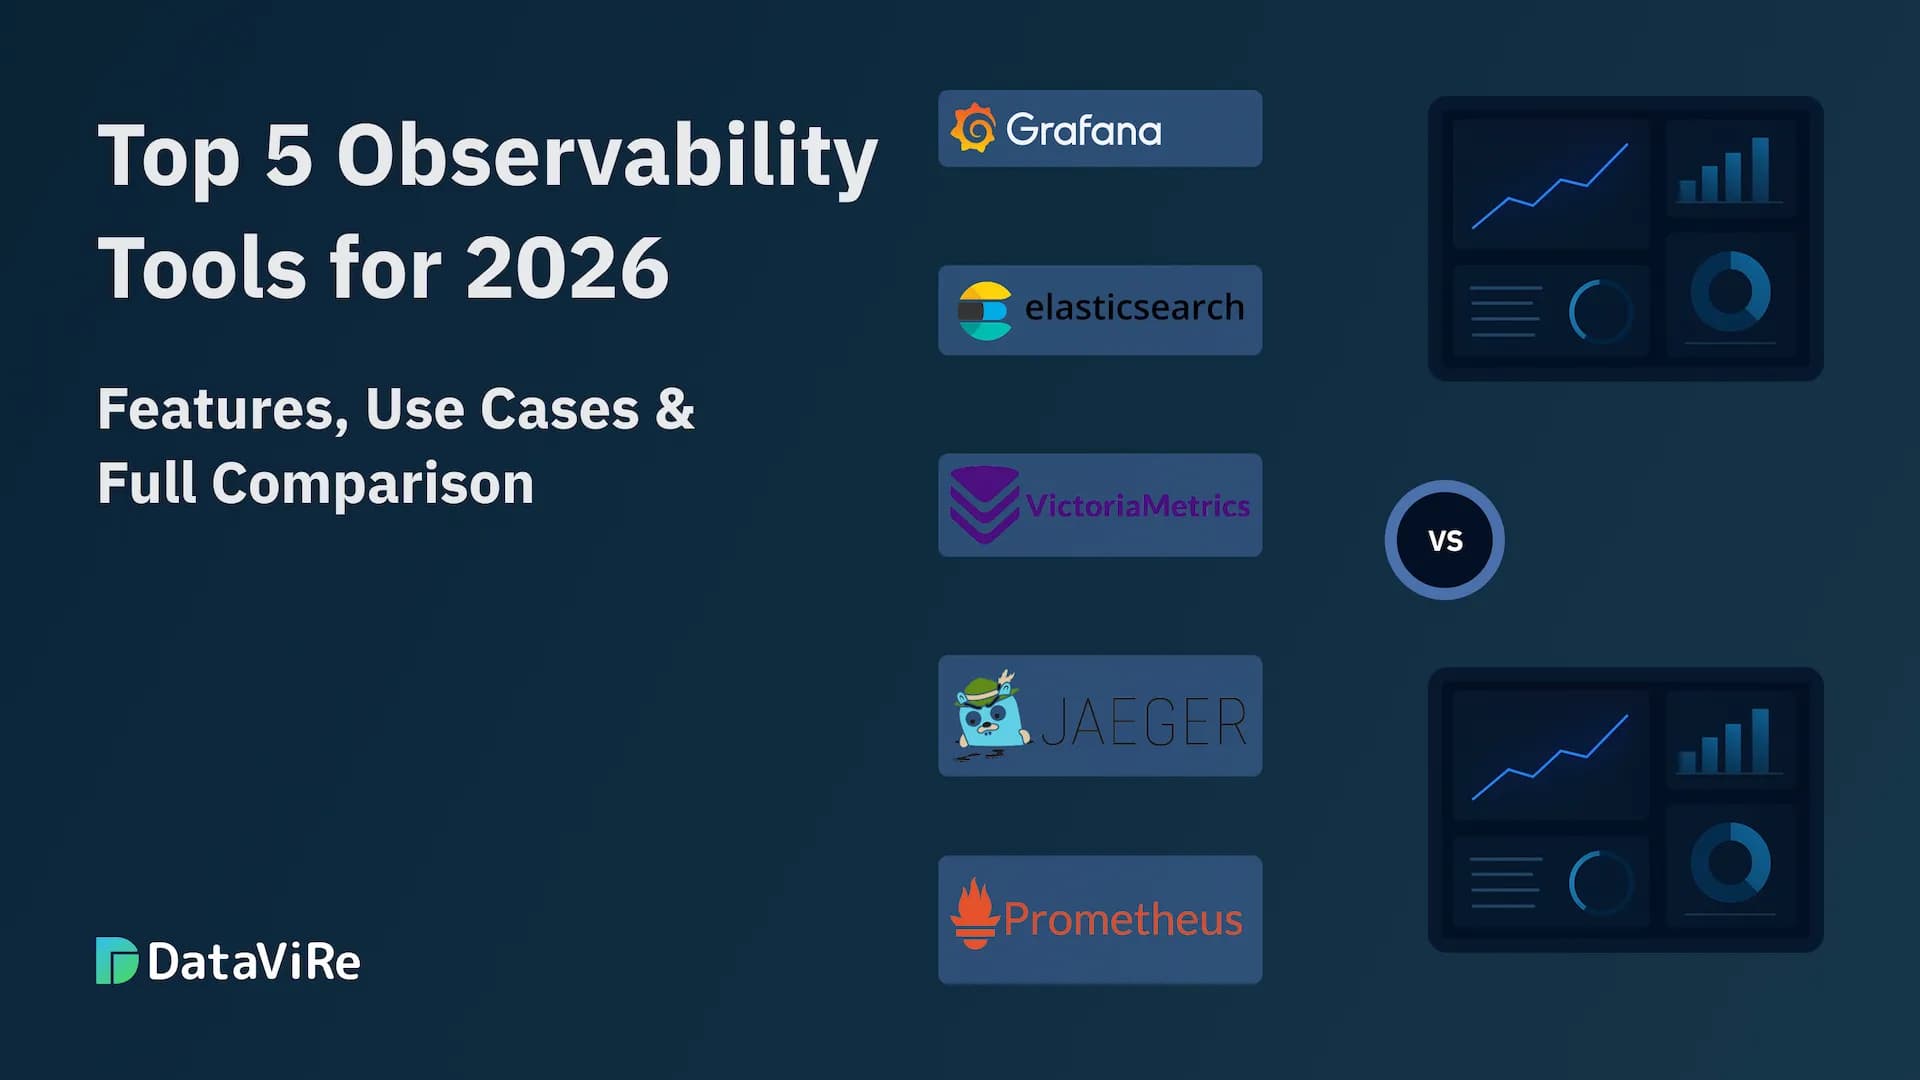
We focus on tools that dominate real production environments in 2026:
- 1. Prometheus - Metrics-first monitoring for cloud-native systems
- 2. Grafana - Unified visualization across metrics, logs, and traces
- 3. Elasticsearch (ELK Stack) - Large-scale log analytics and search
- 4. Jaeger - Deep tracing for microservices and latency analysis
- 5. VictoriaMetrics - High-performance metrics storage at massive scale
Each tool is evaluated on its own strengths, not forced into roles it was never designed for.
Prometheus
Prometheus is not flashy, and that’s exactly why it still wins in 2026.
While many observability platforms try to be “all-in-one,” Prometheus stays brutally focused on one job: high-quality metrics collection and alerting. And for cloud-native systems, that focus is still unmatched.
If your infrastructure runs on Kubernetes and you care about real-time signals over pretty dashboards, Prometheus is foundational-not optional.
What Prometheus Is
Let’s clear a common misconception first.
Prometheus is:
- a metrics collection and storage system
- optimized for time-series data
- designed for pull-based monitoring
- built for ephemeral, dynamic environments
Prometheus is not:
- a log management tool
- a tracing platform
- a full observability suite by itself
Teams that treat Prometheus as a “complete observability solution” usually end up frustrated. Teams that use it as the metrics backbone of a broader observability stack get massive value.
Core Features That Still Matter in 2026
Time-Series Database Built for Scale
Prometheus stores metrics as time-stamped data points optimized for fast ingestion and querying. It handles:
- high-cardinality metrics,
- short scrape intervals,
- and bursty workloads common in Kubernetes environments.
For near-real-time system health, this design still beats generic databases.
PromQL: Still a Power Tool, Not Beginner-Friendly
PromQL remains one of the most expressive query languages for metrics:
- filter by labels,
- aggregate across dimensions,
- calculate rates, percentiles, and error ratios.
Yes, it has a learning curve.
No, there’s still nothing better if you need precise, mathematical insight into system behavior.
Alertmanager: Signal Over Noise
Prometheus alerts are not about “something is wrong.”
They’re about actionable conditions.
With Alertmanager, teams can:
- group related alerts,
- suppress duplicates,
- route notifications by severity or team,
- integrate with Slack, PagerDuty, email, and more.
In mature setups, this drastically reduces alert fatigue.
Kubernetes-Native by Design
Prometheus doesn’t just “support” Kubernetes-it assumes it.
Key strengths:
- automatic service discovery,
- pod-level and node-level metrics,
- native integration with kube-state-metrics and node exporters.
This makes Prometheus the default metrics engine in most Kubernetes clusters, even in 2026.
Best Fit Use Cases
Prometheus is ideal if you need:
- cloud-native metrics monitoring
- Kubernetes observability at scale
- precise SLI/SLO tracking
- reliable alerting without vendor lock-in
If metrics are mission-critical to your uptime-and they are-Prometheus remains non-negotiable in 2026.
Grafana
If Prometheus is the metrics engine, Grafana is the cockpit.
By 2026, Grafana has moved far beyond “just dashboards.” It now acts as a central control plane where metrics, logs, and traces converge. Teams don’t adopt Grafana because it’s pretty-they adopt it because it reduces cognitive load across complex systems.
This is why Grafana sits at the center of most serious observability stacks. Dive into this guide for the in-depth Grafana reporting tools comparison.
Key Capabilities That Matter in 2026
Unified Observability Across Signals
Grafana lets teams correlate:
- a spike in latency (metrics),
- with a surge in error logs (logs),
- tied to a slow service dependency (traces).
This cross-signal visibility is what turns raw data into understanding. Without it, teams waste time jumping between tools and guessing.
Dashboards That Scale With Teams
Grafana dashboards are:
- dynamic,
- variable-driven,
- reusable across environments.
Teams can build:
- service-level views for engineers,
- high-level reliability dashboards for leadership,
- environment-specific dashboards without duplication.
That flexibility is why Grafana survives organizational growth.
Alerting That’s Finally Usable
Grafana’s modern alerting system consolidates alerts across data sources.
Key improvements teams rely on:
- consistent alert rules regardless of backend,
- shared alert templates,
- centralized routing and silencing.
It doesn’t replace Prometheus alerting-it coordinates it.
Massive Data Source Ecosystem
Grafana connects to dozens of systems:
- cloud providers,
- databases,
- CI/CD tools,
- application telemetry platforms.
This makes Grafana the observability glue in heterogeneous environments where no single backend can rule them all.
Best Fit Use Cases
Grafana is ideal if you need:
- a single observability interface for multiple teams,
- cross-signal correlation,
- scalable, role-specific dashboards,
- vendor-neutral observability architecture.
In short: if you operate more than one service, Grafana stops being optional.
Elasticsearch (ELK Stack)
Metrics tell you that something is wrong.
Logs tell you why.
That’s why Elasticsearch remains one of the most important observability tools in 2026-especially for teams dealing with large, noisy, or compliance-heavy systems. When you need to search millions (or billions) of log entries and find answers fast, Elasticsearch still dominates.
Paired with Logstash and Kibana, it forms the ELK Stack: a battle-tested solution for log ingestion, search, and visualization.

Core Capabilities That Matter in 2026
Near Real-Time Log Search
Elasticsearch indexes logs almost immediately after ingestion.
That means teams can:
- search recent incidents while they’re still unfolding,
- filter by service, region, user, or error code,
- correlate errors across distributed systems.
At scale, this speed is non-negotiable.
Kibana: Visualizing Log-Derived Insights
Kibana turns raw logs into:
- dashboards,
- histograms,
- anomaly timelines.
While it’s not as flexible as Grafana for metrics, Kibana excels at log-centric workflows and investigative analysis.
Machine Learning for Anomaly Detection
Elasticsearch includes built-in ML features that:
- learn normal behavior patterns,
- flag unusual spikes or drops,
- surface problems before static thresholds trigger alerts.
For large systems, this reduces blind spots that rule-based alerts miss.
Logstash: Structured Ingestion at Scale
Logstash handles:
- data collection from diverse sources,
- parsing and enrichment,
- normalization before indexing.
This preprocessing is critical. Garbage logs in means useless insights out.
Horizontal Scalability and Resilience
Elasticsearch scales horizontally by design.
Teams can:
- distribute data across nodes,
- replicate indexes for fault tolerance,
- retain massive log histories without downtime.
That’s why it’s still widely used in regulated and high-traffic industries.
Best Fit Use Cases
Elasticsearch is ideal if you need:
- deep log analytics and search,
- long-term log retention,
- compliance and audit trails,
- large-scale troubleshooting workflows.
If logs are central to how you debug systems, Elasticsearch remains hard to replace.
Jaeger
If metrics tell you something is slow and logs tell you what failed, tracing tells you exactly where time is being lost.
In 2026, that capability is non-negotiable for microservices-and Jaeger remains one of the most trusted tools for the job. Originally built at Uber, Jaeger wasn’t designed for demos. It was designed to debug real production latency at scale.

Core Capabilities That Matter in 2026
End-to-End Distributed Tracing
Jaeger tracks a request as it moves through:
- APIs,
- databases,
- queues,
- third-party services.
Each hop is timestamped. The result is a full trace that shows exactly how long each service took.
This is the fastest way to identify performance bottlenecks in complex architectures.
Service Dependency Mapping
Jaeger automatically builds service graphs that visualize:
- upstream and downstream dependencies,
- critical paths,
- overloaded services.
These maps are invaluable during incidents, especially when multiple teams own different services.
Faster Root Cause Analysis
By correlating latency and errors at the trace level, Jaeger helps teams:
- isolate failing components,
- distinguish between symptoms and causes,
- reduce Mean Time to Resolution (MTTR).
This is where tracing outperforms logs and metrics combined.
Native OpenTelemetry Integration
Jaeger works seamlessly with OpenTelemetry, which has become the industry standard for instrumentation.
This means:
- vendor-neutral tracing,
- easier future migrations,
- consistent telemetry across tools.
Teams that adopt OpenTelemetry today avoid painful rewrites tomorrow.
Designed for Scale
Jaeger supports high trace volumes through:
- sampling strategies,
- scalable storage backends,
- distributed collectors.
This allows teams to trace critical requests without overwhelming infrastructure.
Best Fit Use Cases
Jaeger is ideal if you run:
- microservices architectures,
- latency-sensitive applications,
- distributed systems with multiple dependencies,
- OpenTelemetry-instrumented services.
If your users feel slowness before you see errors, Jaeger is the missing visibility layer.
VictoriaMetrics
Prometheus is excellent-until scale exposes its limits.
As metrics volume grows, teams in 2026 increasingly hit the same walls:
- high memory usage,
- short retention windows,
- rising infrastructure costs.
That’s where VictoriaMetrics earns its place. It doesn’t replace Prometheus conceptually-it replaces its pain points.
What VictoriaMetrics Is Designed For
VictoriaMetrics is a high-performance time-series database optimized for:
- massive ingestion rates,
- long-term metrics retention,
- low operational overhead.
It’s commonly deployed as:
- a drop-in Prometheus replacement,
- a long-term storage backend,
- or a centralized metrics platform for multiple teams.

Core Capabilities That Matter in 2026
Extreme Ingestion Performance
VictoriaMetrics is built to ingest millions of samples per second on modest hardware.
This matters when:
- cardinality explodes,
- scrape intervals shrink,
- or IoT and edge devices flood your systems with metrics.
Where Prometheus struggles, VictoriaMetrics stays predictable.
Full PromQL Compatibility
Switching metrics engines is usually painful. VictoriaMetrics avoids that trap.
It supports PromQL natively, which means:
- existing dashboards keep working,
- alert rules don’t need rewrites,
- teams migrate incrementally.
That compatibility is a strategic advantage, not a convenience.
Horizontal Scalability by Design
VictoriaMetrics scales via a clustered architecture:
- storage nodes handle data volume,
- query nodes handle read load,
- ingestion nodes absorb spikes.
This separation lets teams scale only what’s needed, avoiding waste.
Lower Resource Consumption
Compared to traditional Prometheus setups, VictoriaMetrics:
- uses less RAM per time series,
- compresses data more efficiently,
- reduces infrastructure costs significantly.
At scale, this is the difference between sustainable observability and runaway bills.
Native Multi-Tenancy
VictoriaMetrics supports multi-tenant environments out of the box.
This is critical for:
- SaaS providers,
- platform teams serving multiple business units,
- managed observability services.
Prometheus requires workarounds here. VictoriaMetrics doesn’t.
Best Fit Use Cases
VictoriaMetrics is ideal if you need:
- massive-scale metrics ingestion,
- long-term retention without cost explosion,
- PromQL compatibility,
- multi-tenant metrics infrastructure.
If Prometheus is starting to hurt, VictoriaMetrics is the upgrade path-not a detour.
DataViRe: The Missing Layer in Most Observability Stacks
Let’s be blunt: dashboards don’t scale outside engineering teams.
Grafana and Kibana are excellent for live troubleshooting, but the moment you need to:
- share insights with leadership,
- send reports to customers,
- satisfy audits or compliance,
- or preserve historical snapshots,
dashboards alone fall short.
This is where DataViRe fits-and why it exists.
What DataViRe Actually Solves
DataViRe is not another observability backend.
It doesn’t collect metrics, logs, or traces.
Instead, it solves a very specific, very real problem:
- Turning Grafana and Kibana dashboards into professional, automated, shareable reports.
If your observability stack answers “what’s happening now?”, DataViRe answers:
- “What happened last week?”
- “What should I send to stakeholders?”
- “How do I prove uptime, SLAs, or trends?”
Core Capabilities That Matter in Real Teams
Automated Reporting from Grafana and Kibana
DataViRe lets teams generate reports directly from existing dashboards-no rewrites, no rework.
You can:
- schedule reports hourly, daily, weekly, or monthly,
- deliver them automatically via Email, Slack, Microsoft Teams, or WhatsApp,
- eliminate manual screenshots and exports.
This alone saves teams hours every week. Teams who values automation can read this complete guide to know how DataViRe simplifies the process of automated Grafana PDF reporting.
Multiple Output Formats (Not Just PDFs)
Different audiences want different formats.
DataViRe supports:
- PDF for executives and audits,
- Excel and CSV for analysts and operations teams.
This flexibility is what makes observability data usable beyond engineering.
Deep Customization and Branding
Out-of-the-box reports look generic. That’s unacceptable for customer-facing or executive use.
With DataViRe, teams can:
- add logos, headers, footers, and brand colors,
- control layouts, orientations, and templates,
- build reports that look intentional-not hacked together.
Multi-Instance and Multi-Organization Support
For platform teams and service providers, this matters.
DataViRe supports:
- multiple Grafana and Kibana instances,
- separate organizations and roles,
- different time zones and working days.
This makes it viable for enterprise and SaaS environments, not just single teams.
Live Preview and Report History
Before sending a report, you can preview it with live data.
After sending, you can track and download historical reports.
That’s critical for audits, retrospectives, and compliance workflows.
Why DataViRe Belongs in an Observability Stack
Most teams realize too late that:
- observability isn’t just for engineers,
- dashboards are transient,
- reporting is a first-class requirement.
DataViRe doesn’t compete with Grafana or Kibana.
It extends them into workflows they were never designed for.
That’s why it fits naturally into mature observability setups.
Honest Limitations
DataViRe is not magic. Current constraints include:
- you can’t merge multiple Grafana or Kibana dashboards into a single report yet,
- there’s no hosted cloud version at the moment.
If you need SaaS-only, zero-install tooling, this may slow you down.
If you value control, predictability, and on-prem support, it’s a non-issue.
Who Should Actually Use DataViRe
DataViRe makes sense if:
- you rely on Grafana or Kibana today,
- stakeholders demand scheduled or shareable reports,
- you’re tired of manual exports and screenshots,
- you need professional, branded observability reports.
If none of those apply, you don’t need it.
If even two apply, you probably do.
Choosing the Right Observability Tools for 2026
Here’s the straight truth: there is no single “best observability tool” in 2026-and anyone claiming otherwise is selling you something.
Modern systems are too distributed, too dynamic, and too critical for one tool to handle everything well. The teams that succeed are the ones that assemble the right observability stack, not the ones chasing all-in-one promises.
- Use Prometheus when you need fast, reliable metrics and alerting.
- Use VictoriaMetrics when Prometheus starts hurting at scale.
- Use Grafana to make sense of metrics, logs, and traces together.
- Use Elasticsearch (ELK) when logs are your primary source of truth.
- Use Jaeger when latency and microservices complexity hide real problems.
- Use DataViRe when observability data must leave dashboards and reach humans.
Each tool earns its place by solving a specific class of problems. None should be forced to do what it wasn’t designed for.
If your team already uses Grafana or Kibana and struggles with reporting, stop working around the problem.
DataViRe turns your existing observability dashboards into automated, branded, and shareable reports-without changing your stack or adding complexity.
No fluff. No lock-in. Just observability that actually reaches the people who need it.
